
UrbanGazeVis: A Visualization System for Analyzing Eye-Tracking Data on Urban Safety Perception
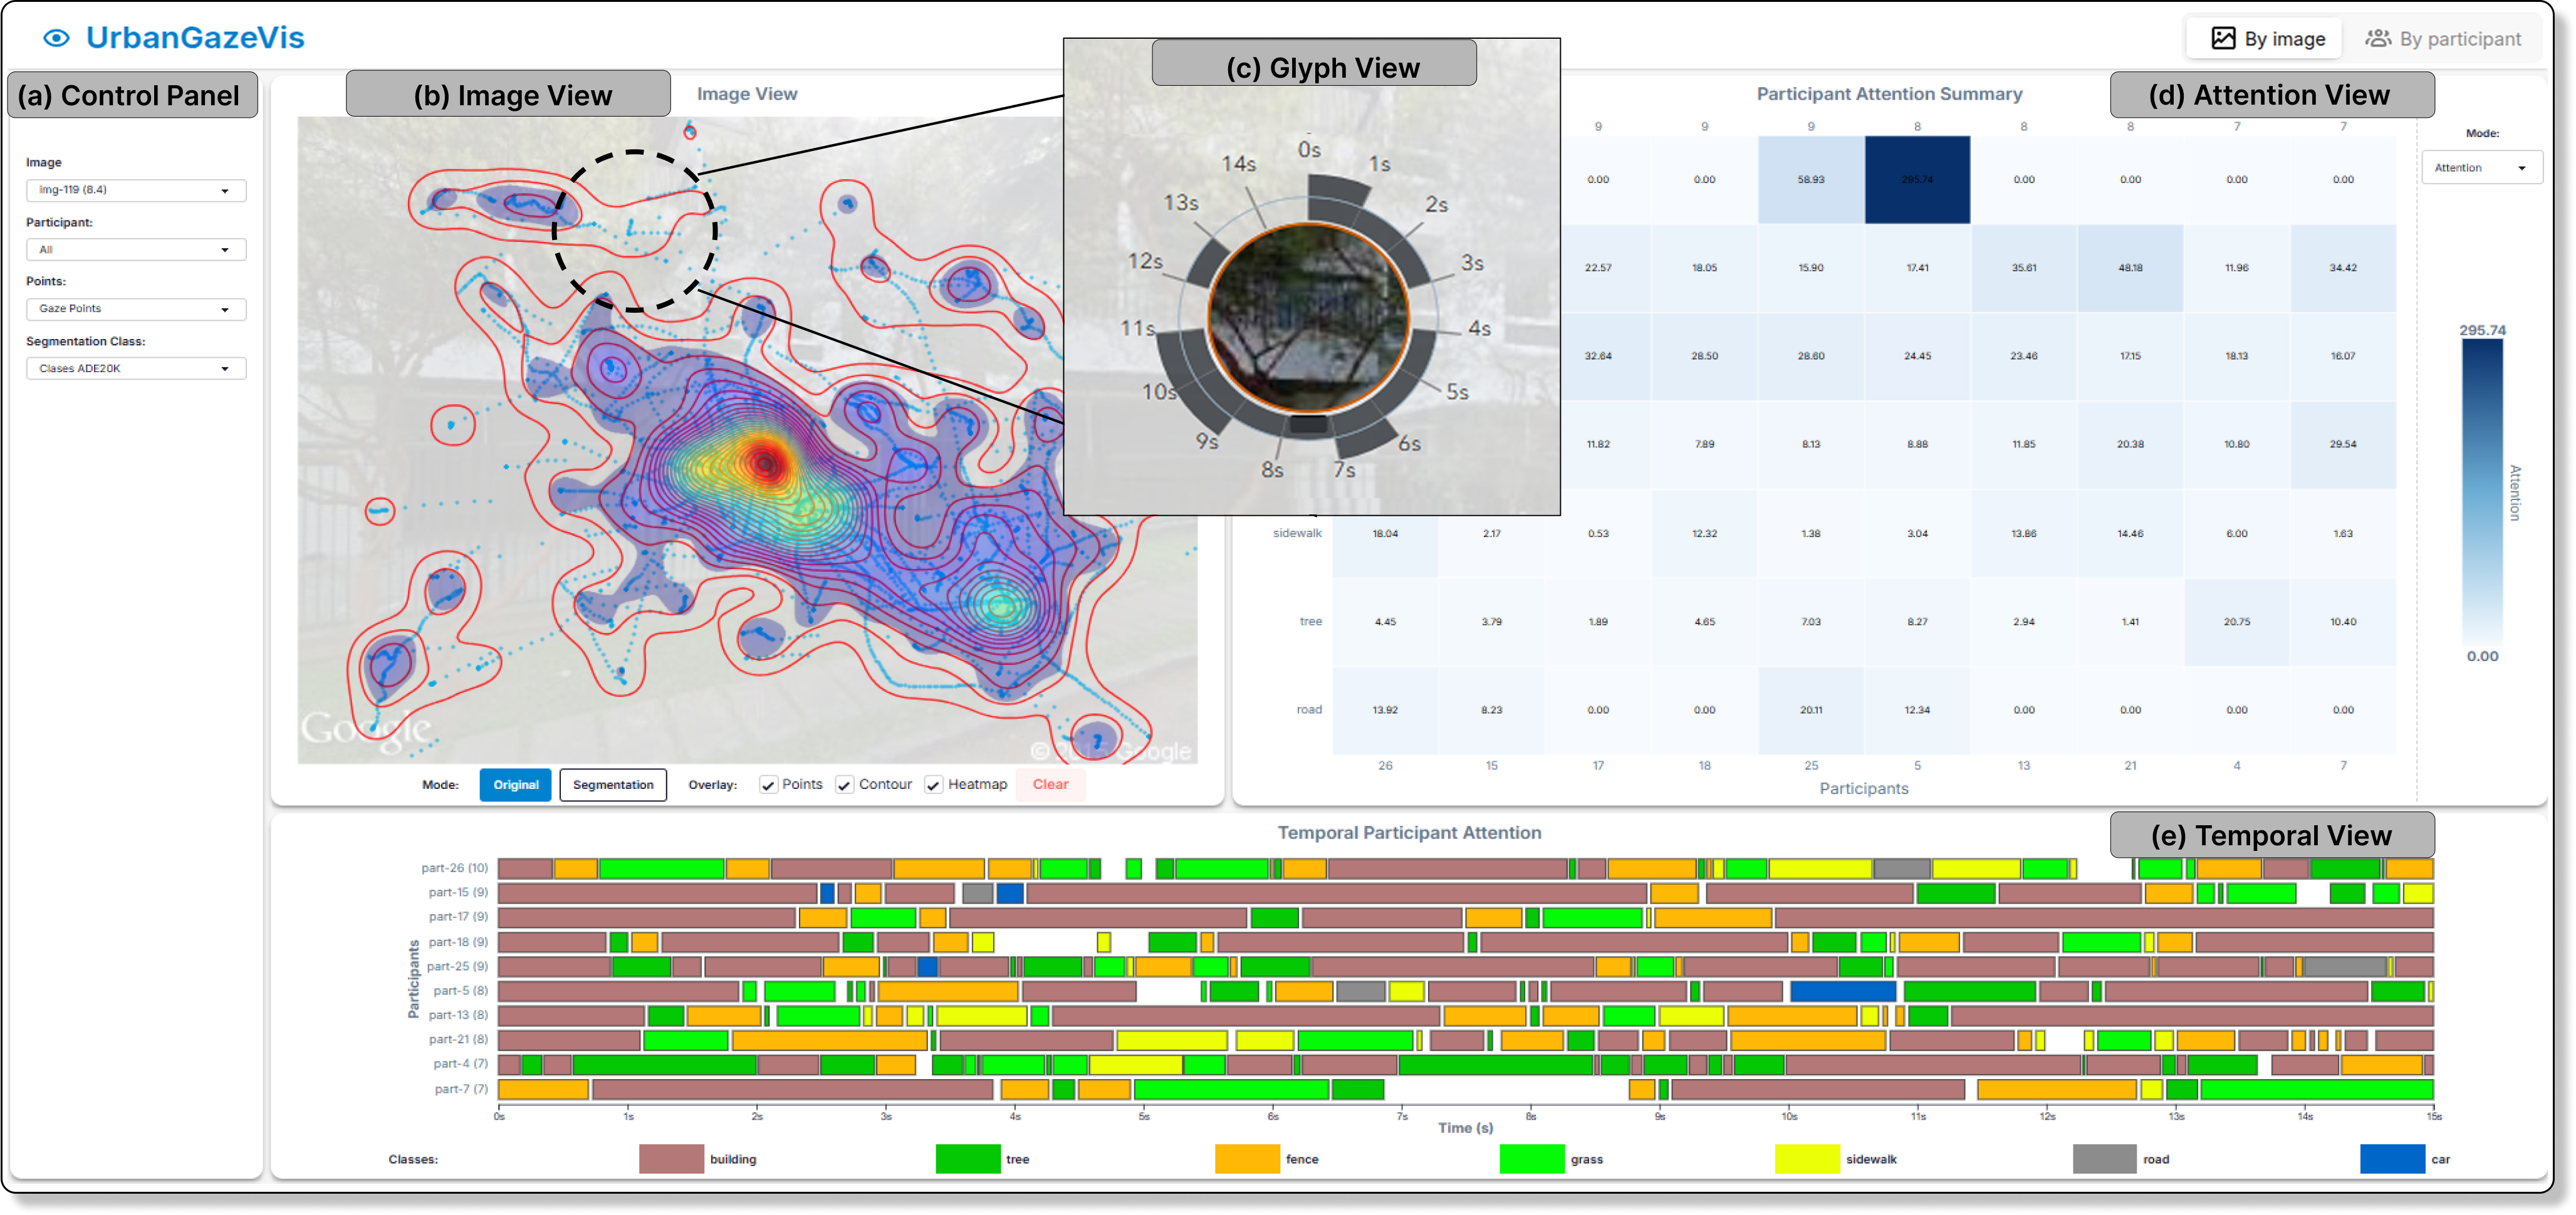
By-Image component of UrbanGazeVis. (a) Control panel for selecting the image, participant filters, point type (gaze or fixation), and semantic representation. (b) Image View showing the selected streetscape with optional overlays for gaze points, density contours, and heatmap, and access to the Glyph View for selected regions. (c) Glyph View, triggered from a circular region of interest in the Image View, summarizing visual exploration within the selected bounds over the 15s trial: stacked radial bars encode participant counts per 1s segment. (d) Attention View (Participant Attention Summary) summarizing Total Attention or normalized Attention Intensity (AttIn) by participant (columns) and semantic class (rows). (e) Temporal View (Temporal Participant Attention) using a scarf-timeline chart to show, for each participant, which semantic class is fixated at each moment during the 15s viewing period. Participant traceability is maintained interactively via tooltips and single-user filtering.
Publication Details
- Venue
- Computers & Graphics
- Year
- 2026
- Publication Date
- August 21, 2026
- DOI
- https://arxiv.org/pdf/2608.21686
Abstract
Perceived safety in streetscapes depends on where people look, yet how gaze relates to visual cues of urban disorder remains poorly understood. Prior work treats safety as an image-level label, offering little insight into how attention to specific elements (e.g, buildings, greenery, people, signs of decay) shapes these judgments. We present a head-mounted eye-tracking study in which 30 participants viewed and rated the safety of 150 street-view images from Rio de Janeiro using a HoloLens 2 headset. Gaze traces were mapped onto semantic segments and disorder cues (e.g., damaged walls, graffiti, overhead cables), yielding a multimodal dataset linking gaze dynamics, scene semantics, and safety scores. To analyze it, we introduce UrbanGazeVis, an interactive visual analytics system with image- and participant-centric views that connects the spatial, temporal, and semantic dimensions of gaze to perceived safety, supporting comparisons between safe and unsafe scenes, inspection of divergent ratings for similar images, and region-of-interest analysis via glyph-based summaries. Statistical models show that sustained attention to physical disorder is associated with lower perceived safety, while the visual analysis reveals context-specific effects often masked by global aggregation. Together, these analyses offer actionable insights for urban design and planning.
Cite this publication (BIBTEX)
@article{2026-UrbanGazeVis,
  title={UrbanGazeVis: A Visualization System for Analyzing Eye-Tracking Data on Urban Safety Perception},
  author={Andres De La Puente and Luis Sante and Felipe A. Moreno-Vera and Mauro Diaz and Jorge Poco},
  journal={Computers & Graphics},
  year={2026},
  url={https://arxiv.org/pdf/2608.21686},
  date={2026-08-21}
}