
Topology-Aware Visual Analysis of GNN Explanations in Dynamic Graphs
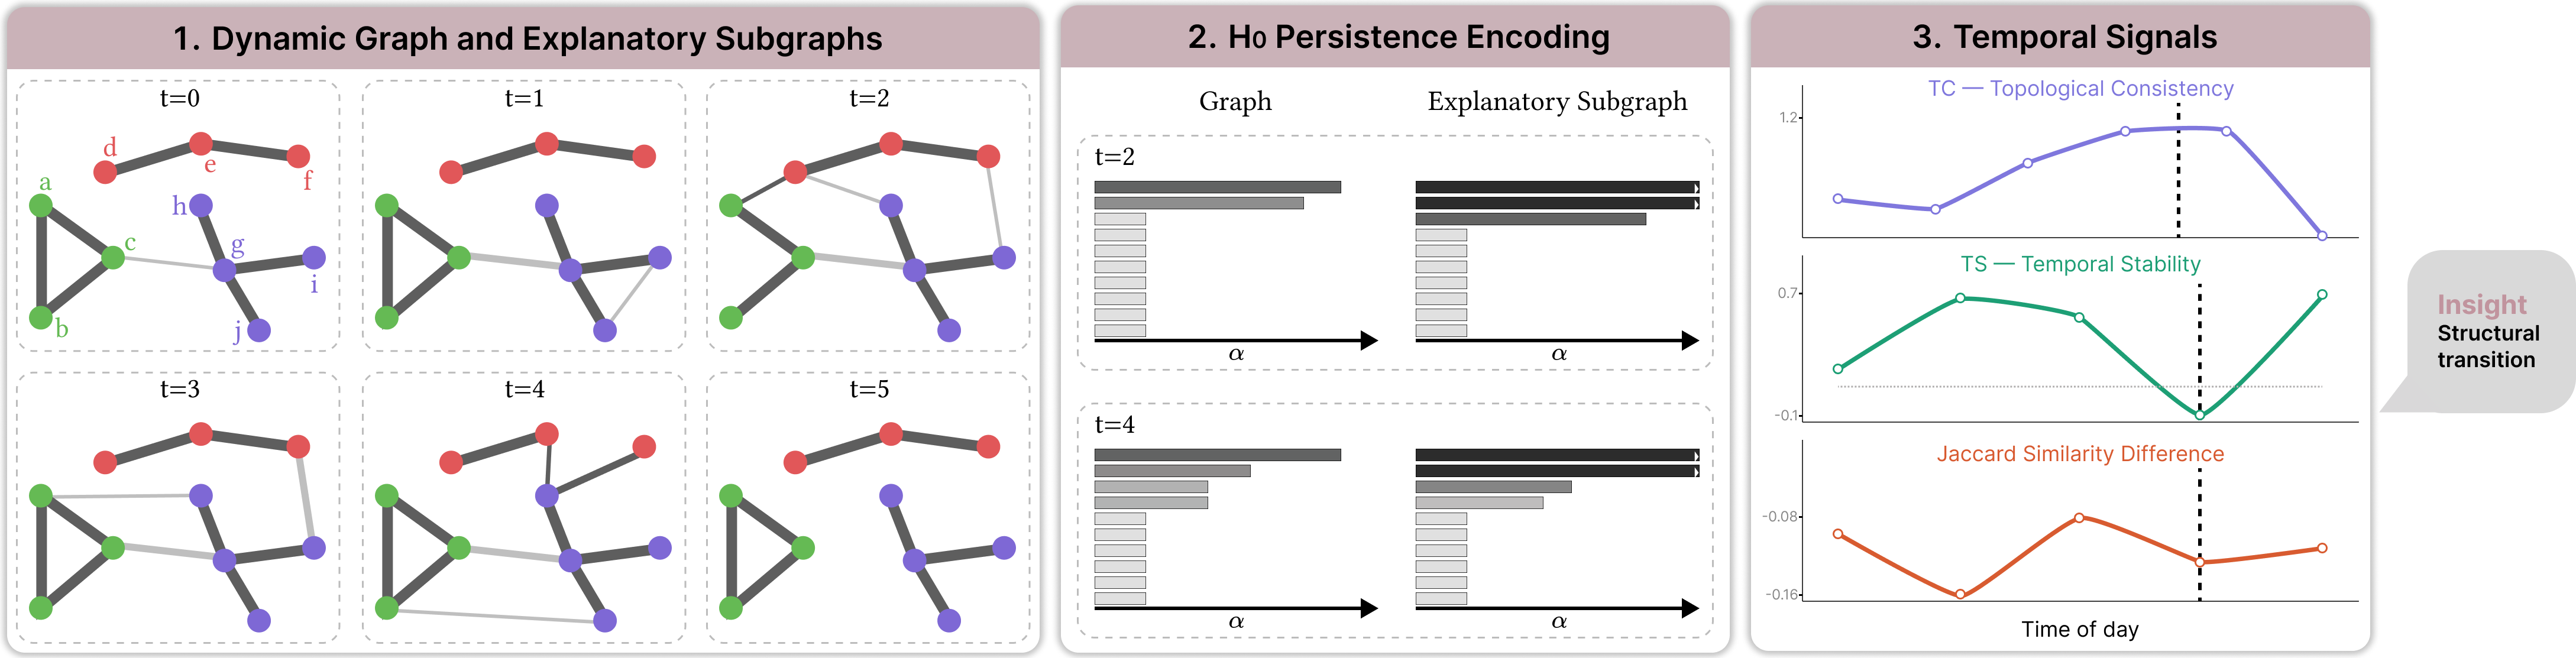
Overview on a controlled toy benchmark. (1) A 10-vertex dynamic graph with three node classes over six timesteps; dark edges denote the explanation and light edges the remaining edges in . Edge thickness encodes connection strength. (2) persistence barcodes for and at two timesteps. (3) Temporal signals: topological consistency , signed temporal stability , and Jaccard similarity difference. The dashed marker at indicates a structural reorganization in .
Publication Details
- Venue
- EuroVis - Posters and Demos
- Year
- 2026
- Publication Date
- May 26, 2026
- DOI
- https://doi.org/10.2312/evpd.20261001
Abstract
Graph neural networks (GNNs) are increasingly applied to dynamic graphs, where explanations should remain coherent as graph structure evolves. Existing fidelity metrics provide scalar summaries and do not capture structural alignment or temporal behavior. This work introduces a persistent-homology-based visualization approach that treats persistence-distance distortions between data graphs and explanations as temporal signals. We introduce topological consistency (TC), measuring per-step structural deviation, and temporal stability (TS), capturing and attributing changes over time. We demonstrate the approach on a controlled toy example and a high-school contact network, showing that topology-aware signals reveal structural behaviors not captured by set-based similarity measures.
Cite this publication (BIBTEX)
@article{2026-TopoXignals,
  title={Topology-Aware Visual Analysis of GNN Explanations in Dynamic Graphs},
  author={Juanpablo Heredia and Jorge Poco},
  journal={EuroVis - Posters and Demos},
  year={2026},
  url={https://doi.org/10.2312/evpd.20261001},
  date={2026-05-26}
}