
GroundSTory: Interactive Storytelling for Grounded Spatiotemporal Anomaly Explanations with Graphs and Large Language Models
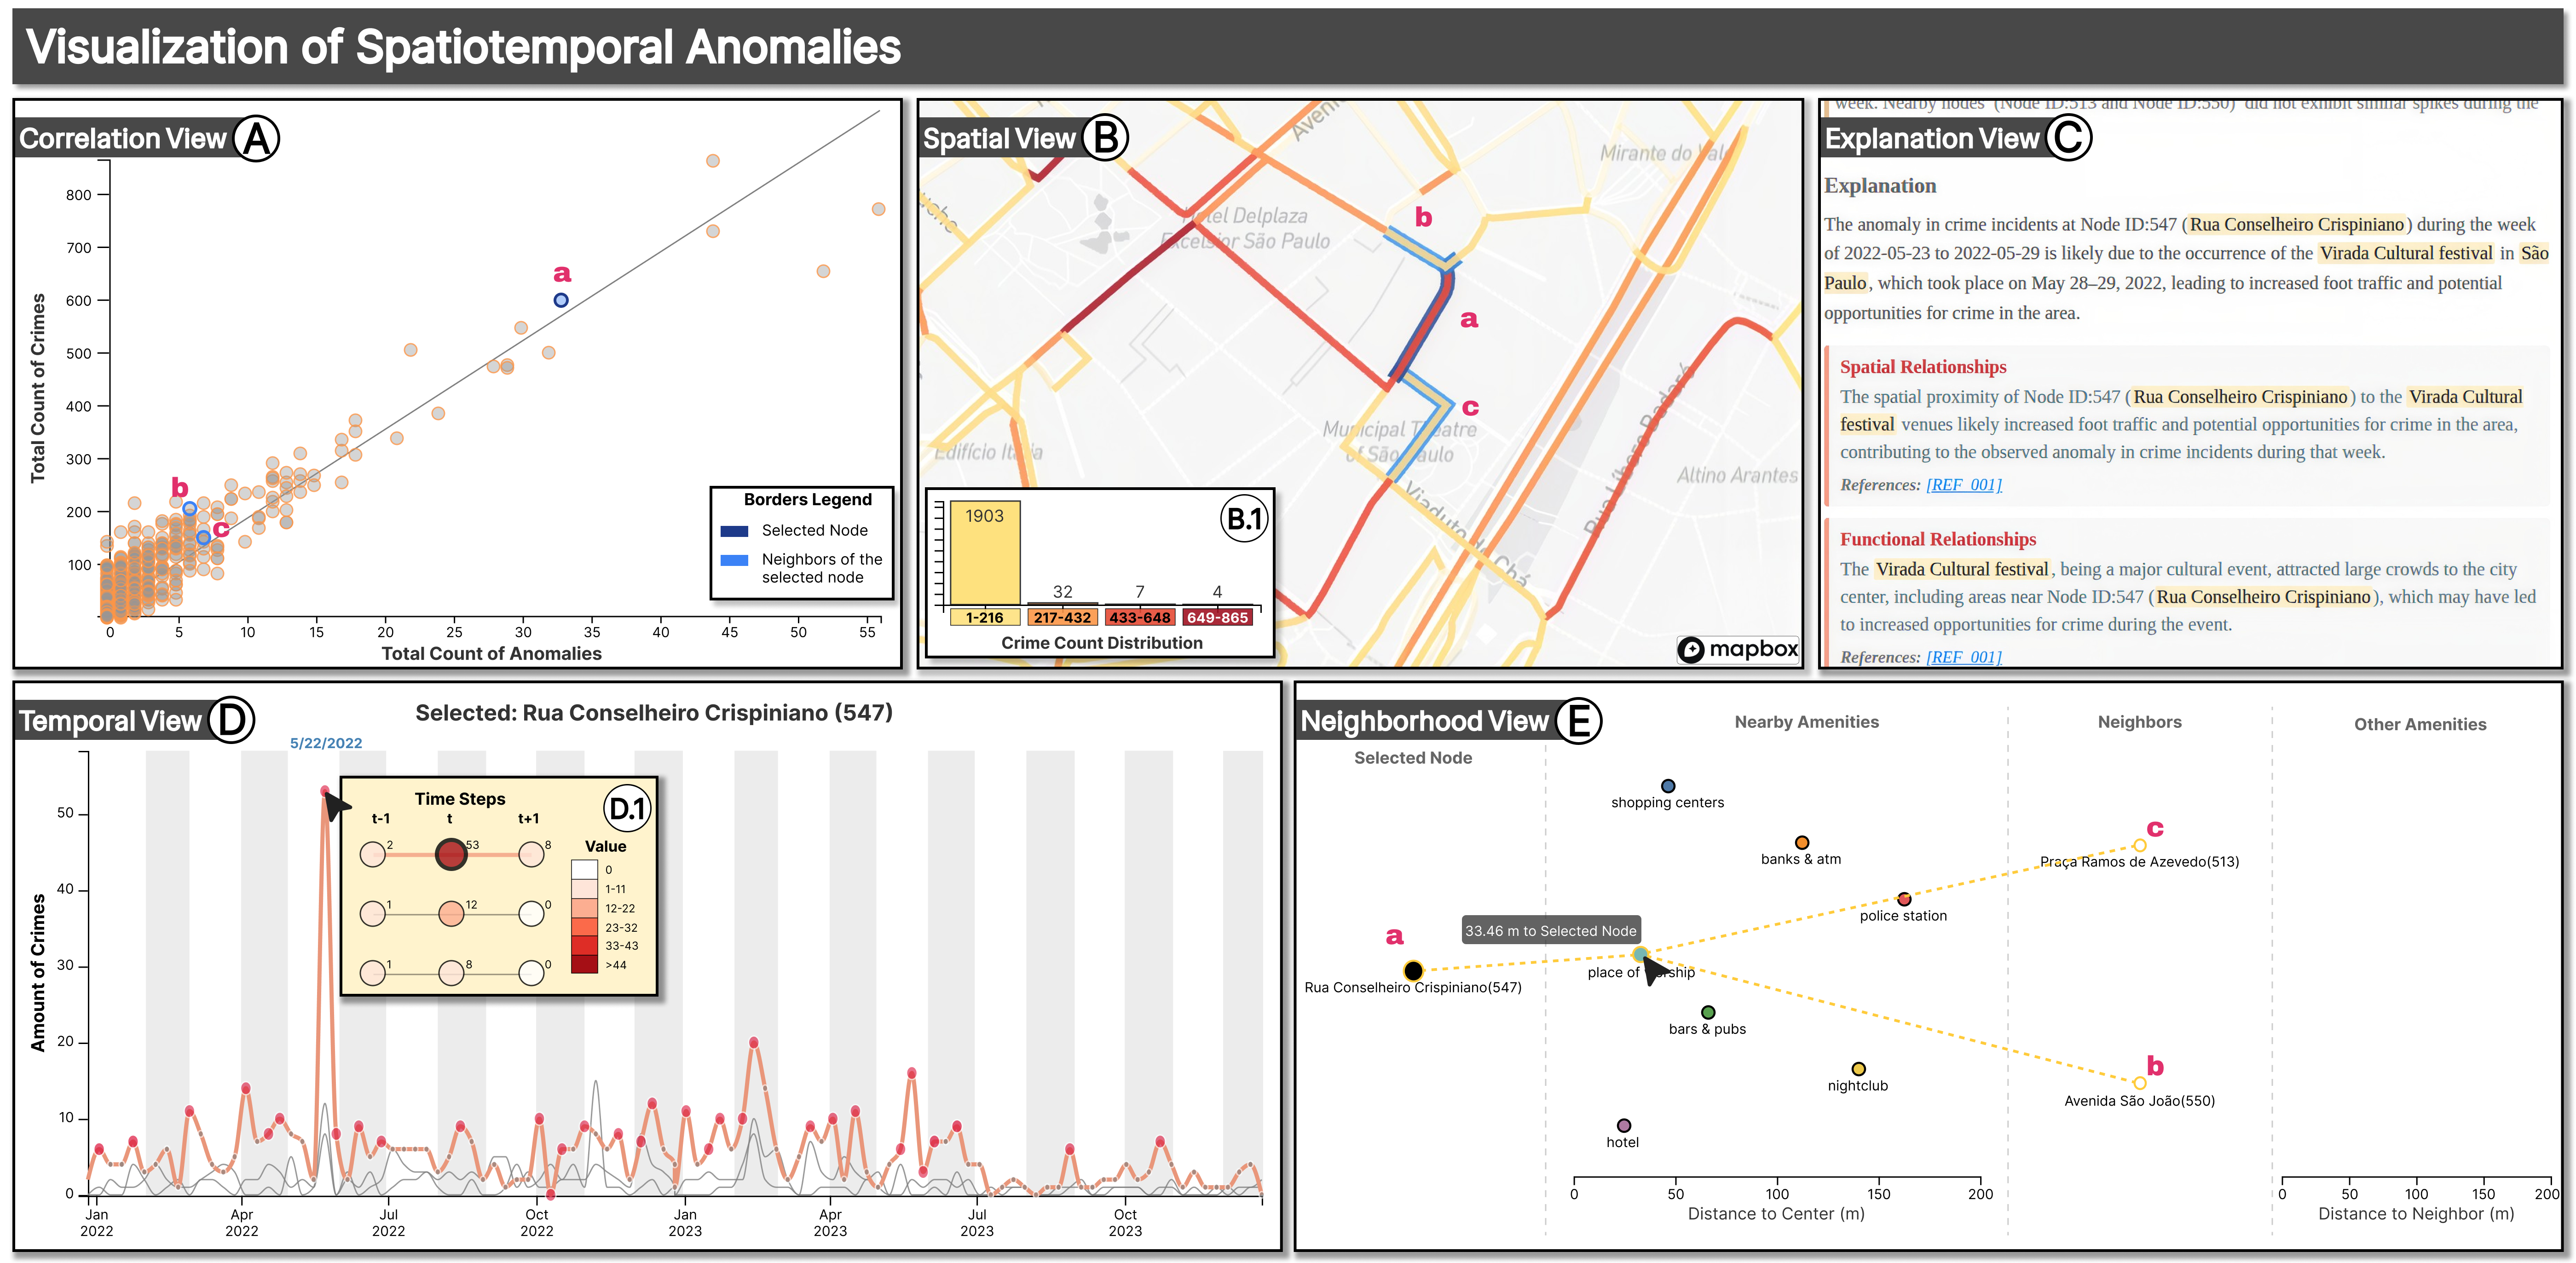
The visualization tool. (A) Correlation View: incident and anomaly counts per node. (B) Spatial View: node map and selected neighborhood; colors encode incident counts (B.1). (C) Explanation View: LLM-generated narrative. (D) Temporal View: selected-node time series with anomaly context on hover (D.1).(E) Neighborhood View: selected-node local subgraph and nearby amenities. © 2025 IEEE. Reprinted, with permission.
Publication Details
- Venue
- ACM Transactions on Intelligent Systems and Technology
- Year
- 2026
- Publication Date
- October 11, 2026
- DOI
- https://doi.org/10.1145/3856820
Abstract
Explaining anomalies in spatiotemporal data requires more than identifying statistical deviations; it often demands coherent narratives that relate events to their spatial, temporal, and social context. In urban settings, where anomalies may reflect public events, behavioral shifts, or environmental factors, the lack of interpretable, contextual explanations limits the effectiveness of automated analysis. We present GroundSTory, an interactive framework that reframes spatiotemporal anomaly explanation as computational storytelling, integrating graph-based representations of urban space, coordinated visual analytics, and large language models (LLMs) to support the construction of grounded, human-readable narrative explanations. Anomalies act as narrative anchors, while localized spatial and temporal relations and contextual signals derived from the graph guide and constrain narrative generation. The LLM functions as a narrative assistant, proposing plausible, evidence-backed hypotheses that analysts can inspect, compare, and validate through visual interaction. We illustrate the approach through qualitative usage scenarios on real-world urban datasets from São Paulo and New York City, showing how interactive narratives surface meaningful links between detected anomalies and contextual factors such as holidays, mass events, and routine activity patterns. A prompt analysis further suggests that structured, graph-derived context tends to affect the stability and perceived quality of generated hypotheses. Overall, our results indicate that combining knowledge-driven representations, interactive visualization, and constrained prompting can support more coherent, plausible, and interpretable narratives for spatiotemporal anomaly analysis, contributing to ongoing research in interactive storytelling and narrative-centered AI systems.
Cite this publication (BIBTEX)
@article{2026-GroundSTory,
  title={GroundSTory: Interactive Storytelling for Grounded Spatiotemporal Anomaly Explanations with Graphs and Large Language Models},
  author={Juanpablo Heredia and Leighton Estrada-Rayme and Jeremy Matos-Cangalaya and Jorge Poco},
  journal={ACM Transactions on Intelligent Systems and Technology},
  year={2026},
  url={https://doi.org/10.1145/3856820},
  date={2026-10-11}
}