JamVis: Exploration and Visualization of Traffic Jams
Abstract
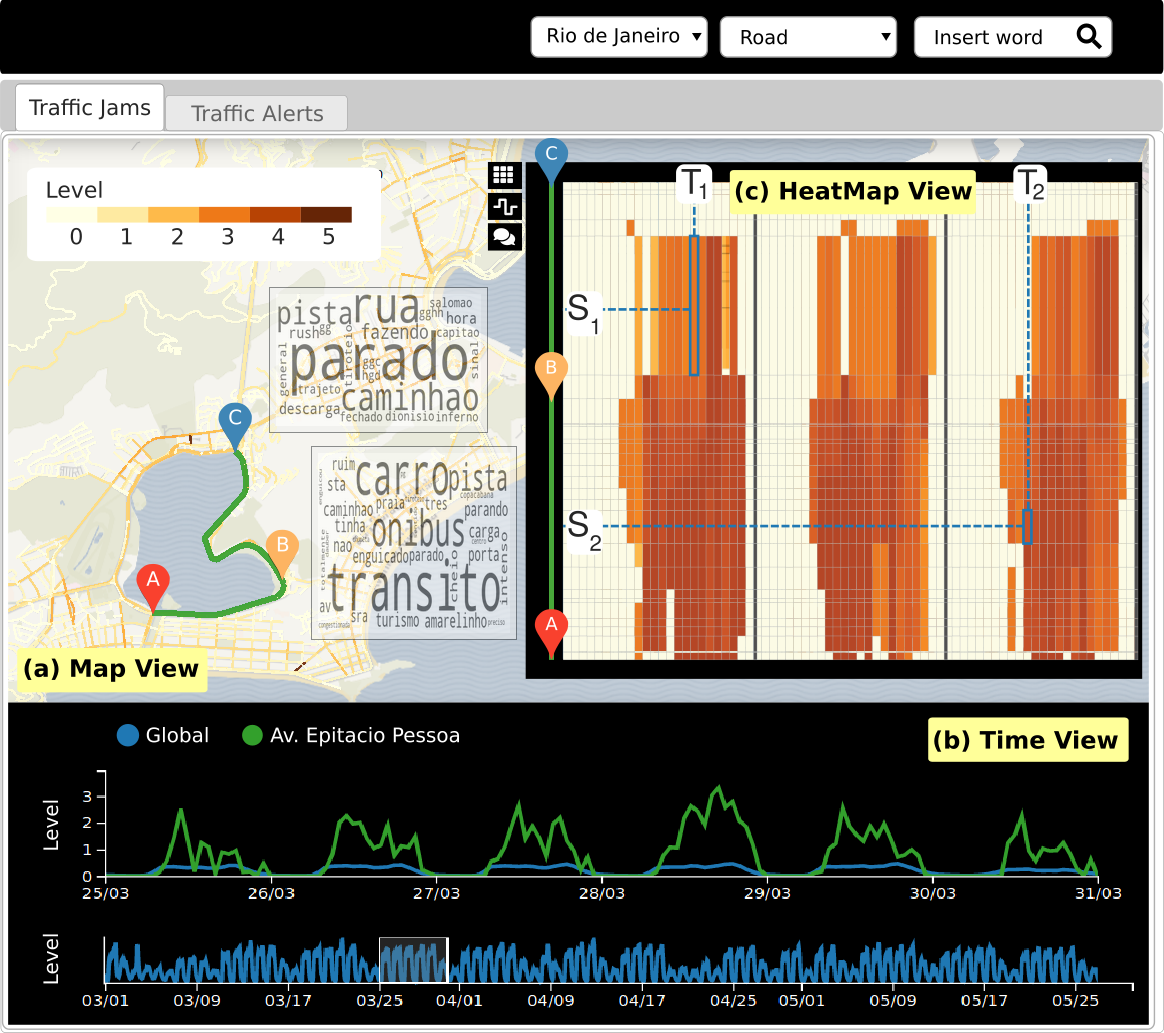
Traffic jams are a significant problem in urban cities that cause pollution and waste fuel, money, and time. Therefore, there is an urgent need to build tools that enable authorities to monitor and understand traffic dynamics and their causes. However, exploring these large complex data presents a challenge to domain experts. This paper proposes JamVis, a web-based visual analytics framework that leverages Waze's multi-modal spatio-temporal data to this end. JamVis comprises two main components designed based on requirements elicited from domain experts. The first one supports the exploration of Waze's traffic jam information through multiple linked views. The second component allows identifying events through alerts reported by Waze users about different problems (e.g., potholes, floods, or heavy traffic). A new algorithm called TST-Clustering is introduced to perform event detection, which is an adaptation of the DB-Scan algorithm that allows clustering alerts by space, time, and type. Furthermore, to provide an overview of this algorithm's spatio-temporal results, we introduce a novel visualization called ST-Heatmap. JamVis is validated through three usage scenarios analyzing different events in Rio de Janeiro.
Cite this publication (BIBTEX)
@article{2022-JamVis,
  title={JamVis: Exploration and Visualization of Traffic Jams},
  author={Elio Rodriguez and Nivan Ferreira and Jorge Poco},
  journal={The European Physical Journal Special Topics (EPJ ST)},
  year={2022},
  url={null},
  date={2022-01-27}
}