Abstract
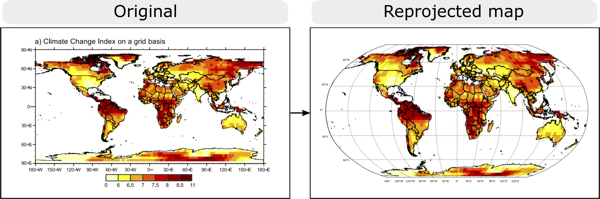
Map charts are used in diverse domains to show geographic data (e.g., climate research, oceanography, business analysis, etc.). These charts can be found in news articles, scientific papers, and on the Web. However, many map charts are available only as bitmap images, hindering machine interpretation of the visualized data for indexing and reuse. We propose a pipeline to recover both the visual encodings and underlying data from bitmap images of geographic maps with color-encoded scalar values. We evaluate our results using map images from scientific documents, achieving high accuracy along each step of our proposal. In addition, we present two applications: data extraction and map reprojection to enable improved visual representations of map charts.
BibTeX
@inproceedings{2018-ExtractingMapEncoding,
 title = {Extracting Visual Encodings from Map Chart Images with Color-encoded Scalar Values},
 author = {A. Mayhua AND Erick Gomez-Nieto AND Jeffrey Heer AND Jorge Poco},
 booktitle = {Graphics, Patterns and Images (SIBGRAPI) },
 year = {2018},
 url = {http://www.visualdslab.com/papers/ExtractingMapEncoding},
}